× NUST Downloads NUST UG Admissions Enter to NUST NUST Admission Policy NUST Merit Criteria `International Applicants NUST DAE Criteria NET Syllabus and Pattern NUST Eligibility Criteria FA/FSc - Apply which Program? Non FA/FSc - Apply which Program? NUST Admission through SAT/ACT NUST Admission through SAT

MCQ Data Interpretation - Bar Charts

The CAT Online Free Test Prep MCQs Data Interpretation - Bar Charts

Data Interpretation: Bar Charts

Question:

According to the chart shown, which of the following is closest to the median annual number of shipments of manufactured homes in the United States for the years from 1990 to 2000, inclusive?

01 di bargraph -69444120
Option A:      250,000
Option B:      280,000
Option C:      310,000
Option D:      325,000
Option E:      340,000
  A     B     C     D     E  
Show/Hide Answer and Explanation

Correct Answer: C

Explanation Video

Explanation

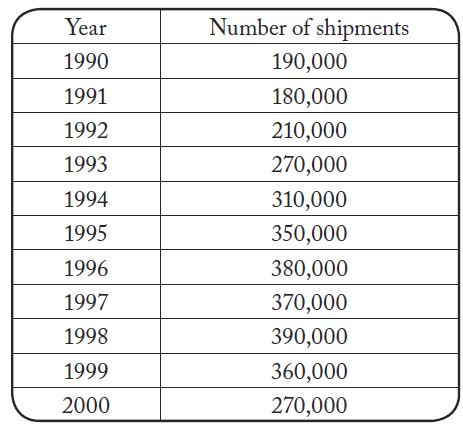
From the chart, the approximate numbers of shipments are as follows:

02 di bargraph -15433433

Since there are 11 entries in the table and 11 is an odd number, the median of the numbers of shipments is the 6th entry when the numbers of shipments are arranged in order from least to greatest. In order, from least to greatest, the first 6 entries are:

03 di bargraph -22767146

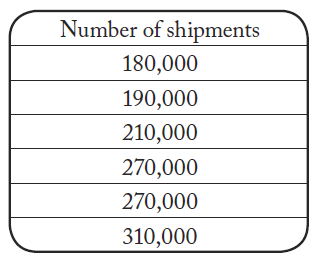
The 6th entry is 310,000.

Th e correct answer is C.

Prev       1 of 8       Next

How to Solve Bar Charts

For Bar Charts question first understand the statement and the question stem. Try to solve and click the corresponding answer option. The drop down will appear to show the correct answer and explanation.